Introduction
I frequently encounter X-ray EDS analyses where there is a very intense C peak accompanied by a small O peak. The Oxford AZtec software almost never identifies this peak with its auto identification routine. I wanted to understand why. Pulse-pileup artifacts are a major problem. Two C X-rays entering the detector at the same time have an energy just slightly higher than that of a C X-ray. In the case of my standard, one could observe pulse-pileup effects at high count rates, yet at low count rates the O peak appeared to be real.
Background
In November 2014 the Probe Software Forum had a discussion of “Fictitious oxygen peaks in graphite” in the “General EDS Issues” section.
Les Moore started the discussion with this question:
I have noticed a fictitious oxygen peak thrown up on my EDS spectra on a SDD detector - I know it is fictitious as WDS says so. It is most likely the doubling peak. # The problem is, it is still quite apparent at 5% DT. I use the axiom that doubling peaks aren’t an issue until you get up to 20-30% DT. If this is the case, is this an issue with the new SDD detectors - i.e. easy doubling at low energies?
If you run the spectra through a standardless ZAF pkg, it comes up with 10% oxygen.
It is not very dependent on pulse processing setup.
I found the same on oxygen but other elements got in the way so I could not be sure.
Anyone have any experience on this?
John Donovan replied:
I have a difficult time seeing how this could be a sum peak because in steel what could be present at high concentrations enough to cause sum peaks (Fe La, but that’s 0.7 keV, not 0.51 keV). And carbon is 0.277 x 2 = 0.55 keV so not that close though EDS might be fooled…
Could it be a surface oxidation peak? What keV are you at?
Could it be a V La peak? Even with WDS, the V La is almost on top of the O Ka…
Les Moore responded
Not steel in this case.
This work was done on the graphite I was looking at in my other post. The middle of some of the (micro) char particles have no significant O by WDS i.e. no discernible peak above background yet the EDS showed heaps. Our other machine (ASPEX) SDD EDS also showed the same effect but this time on a analytical graphite crucible.
The other mystery is if it is there, why was it’s ratio to the C Ka a function of total dead time rate?
I suppose I could look at any doubling of the Fe La on steel to see if this has similar issues.
Just a bit of an oddity that worries me - oxygen in a “second phase particle in steel” analysis means a remnant de-oxidation or re-oxidation product, carbon means exactly the opposite.
Dale Newbury of NIST responded,
Low photon energy peaks are especially prone to coincidence (and have always been, including for Si(Li)-EDS performance), because the charge pulse of a low photon energy x-ray is just above the noise floor and inspection/discrimination functions are ineffective.
There is a very easy way to determine if the suspect peak is due to coincidence: just progressively lower the beam current (e.g., successive factors of 2) and compare the spectra (scaled to the C peak in this case). This experiment is illustrated in the attached pdf for the Bruker QUAD SDD that we have on our probe (feel free to share this pdf), as well as some nice examples of trace level SDD-EDS work in the presence of coincidence and severe overlap.
Dale appended this figure
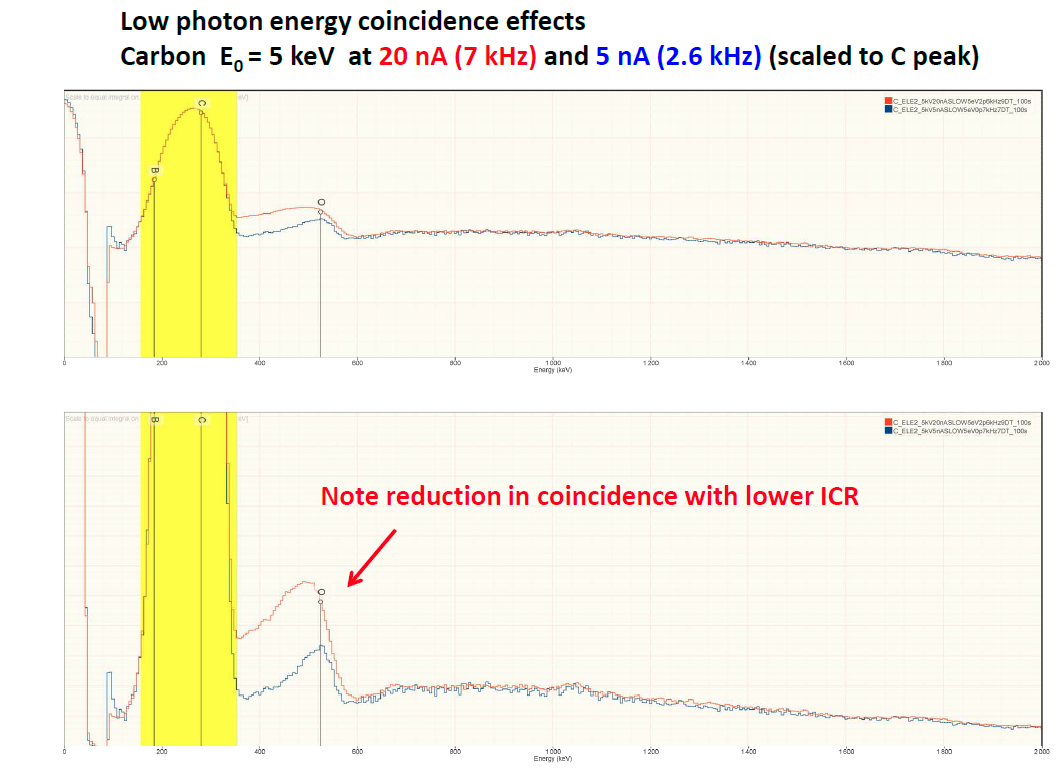
Figure 1: Spectrum from Bruker QUAD SDD.
Les Moore responded:
I initially did as you suggested and this is why I posted the query.
My results:
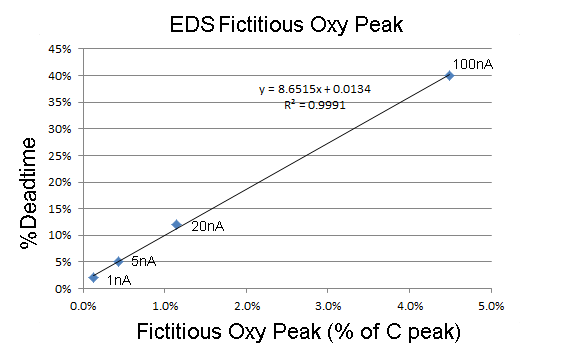
Figure 2: Les Moore’s results.
My experiment (2017-09-15)
I have a Ted Pella XCS-8 EDS Calibration Standard (P/N 659-8) that has a C standard described as “Carbon (glassy, >99.9% Sigri Electrographit GmbH) – to be used for light element detector testing”.
I began by calibrating the energy resolution of the detector using Cu from the standard at 20 kV.
I then dropped the microscope voltage to 5 kV and recorded “beam measurement” spectra from the C standard at the following spot sizes, recording the probe current on my Keithley Model 480 picoammeter.
| Spot Size | nA | live time sec |
|---|---|---|
| 3 | 0.10 | 3302.11 |
| 4 | 0.36 | 752.08 |
| 5 | 1.54 | 173.37 |
| 6 | 6.50 | 99.92 |
One major difficulty that I have is that the Oxford AZtec software will not export pulse-pileup corrected spectra to a .msa file for analysis using DTSA-II. I did two types of analyses:
Export the raw spectra to DTSA-II and analyze
I used DTSA-II to scale the spectra to the C integral following Dale Newbury’s approach.
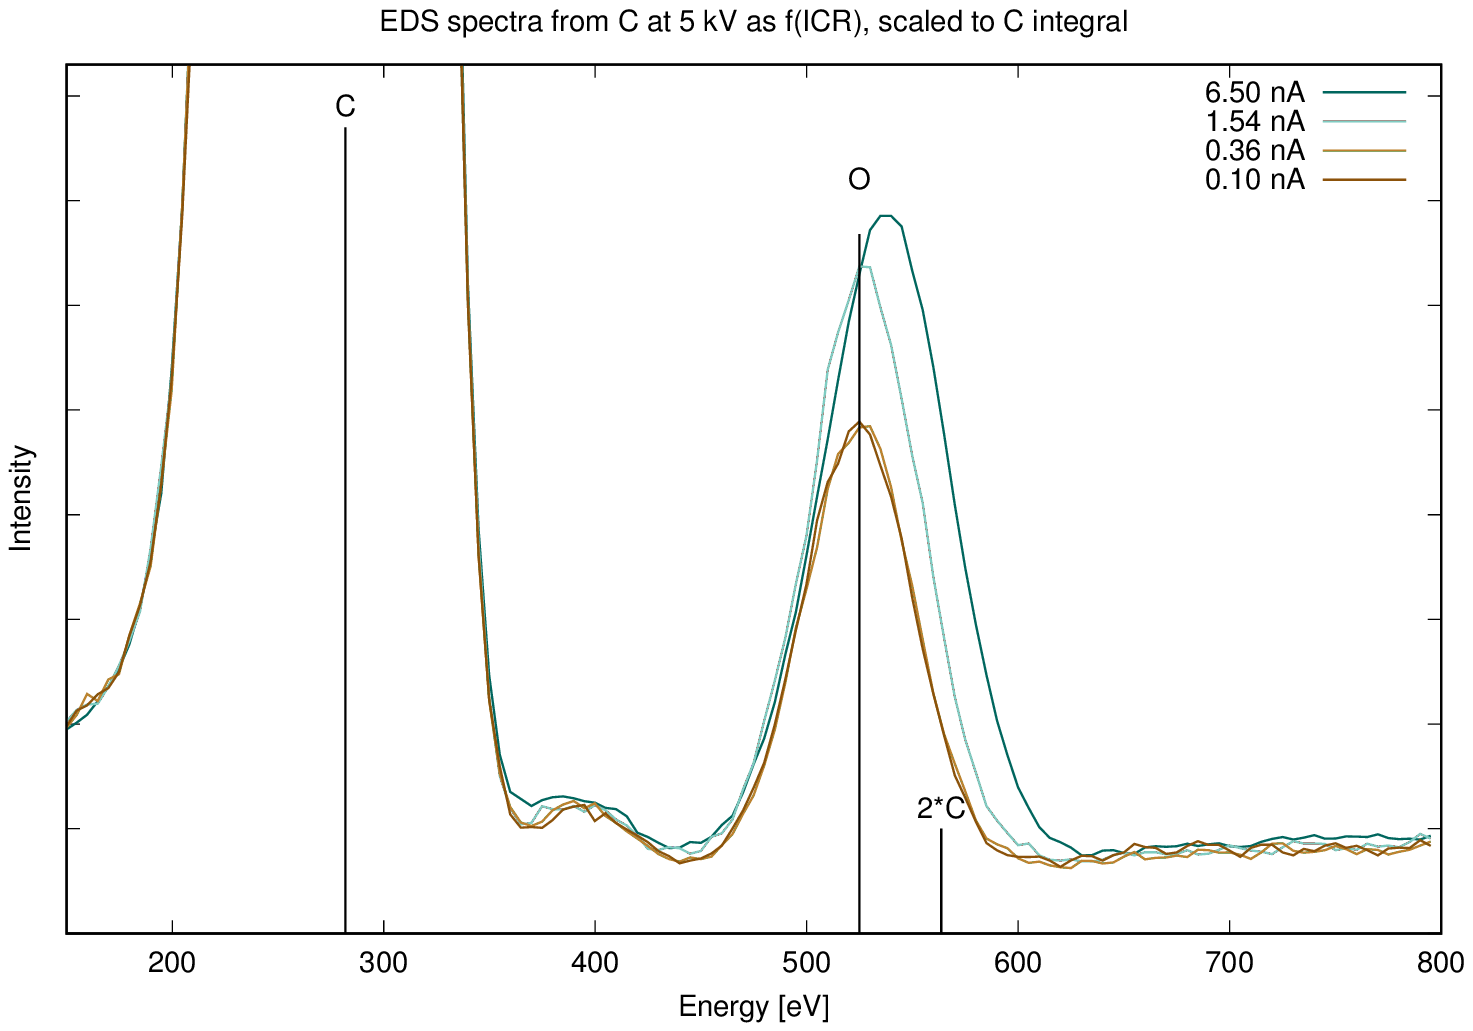
Figure 3: Input count rate series without pulse-pileup correction. Note how the lowest two count rates precisely fit the expected energy of the C X-ray. Note the distortion to higher energy of the spectrum from the highest two energies.
Overlay pile-up corrected and uncorrected spectra
I then used the Oxford software to overlay spectra with and without pulse pile-up correction. I exported each as .png files and prepared a montage using ImageJ.
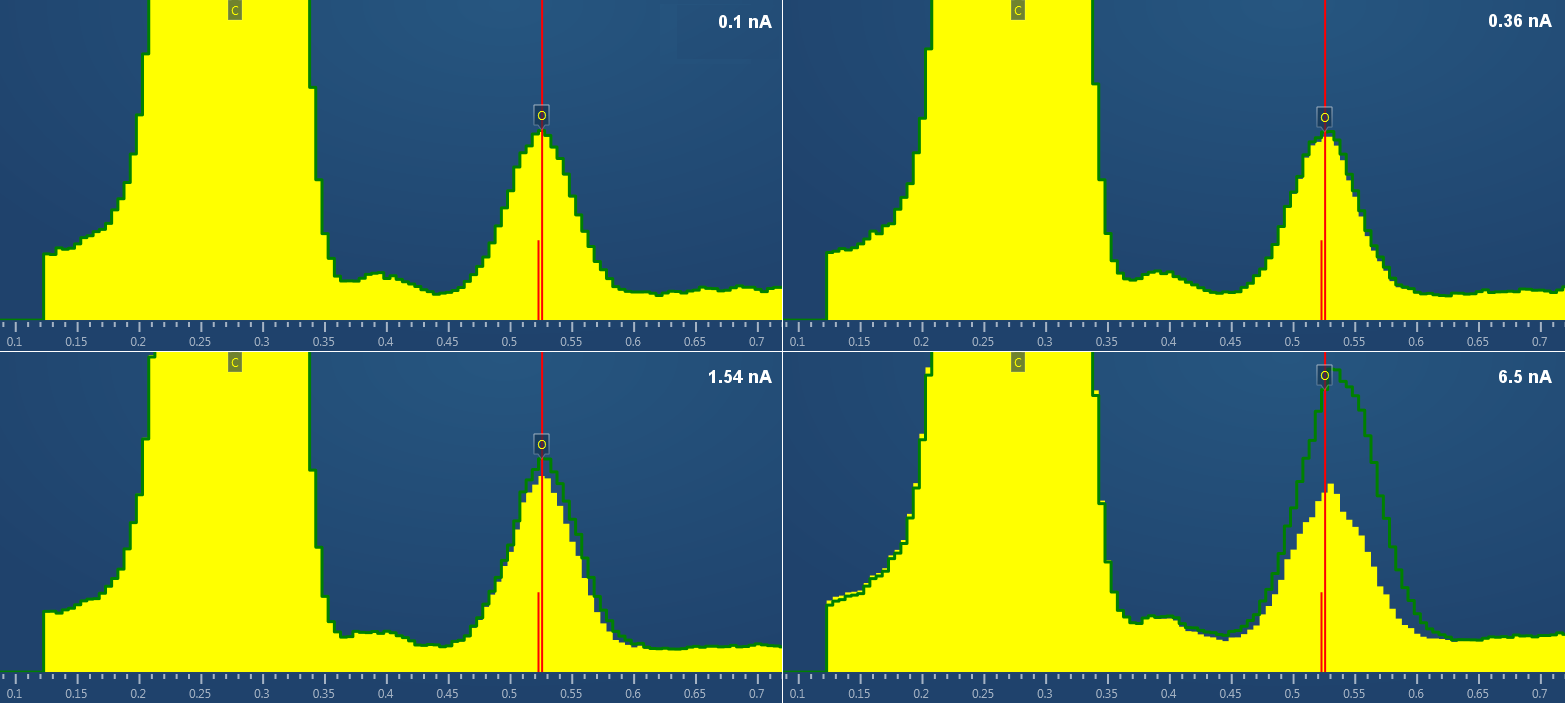
Figure 4: Montage of spectra with (yellow) and without (green) pulse-pileup correction. Note that the corrected peak always looks like O even at very low count rates.
Feedback from Dale Newbury at NIST
I sent these data to Dale Newbury who responded with data from their system.
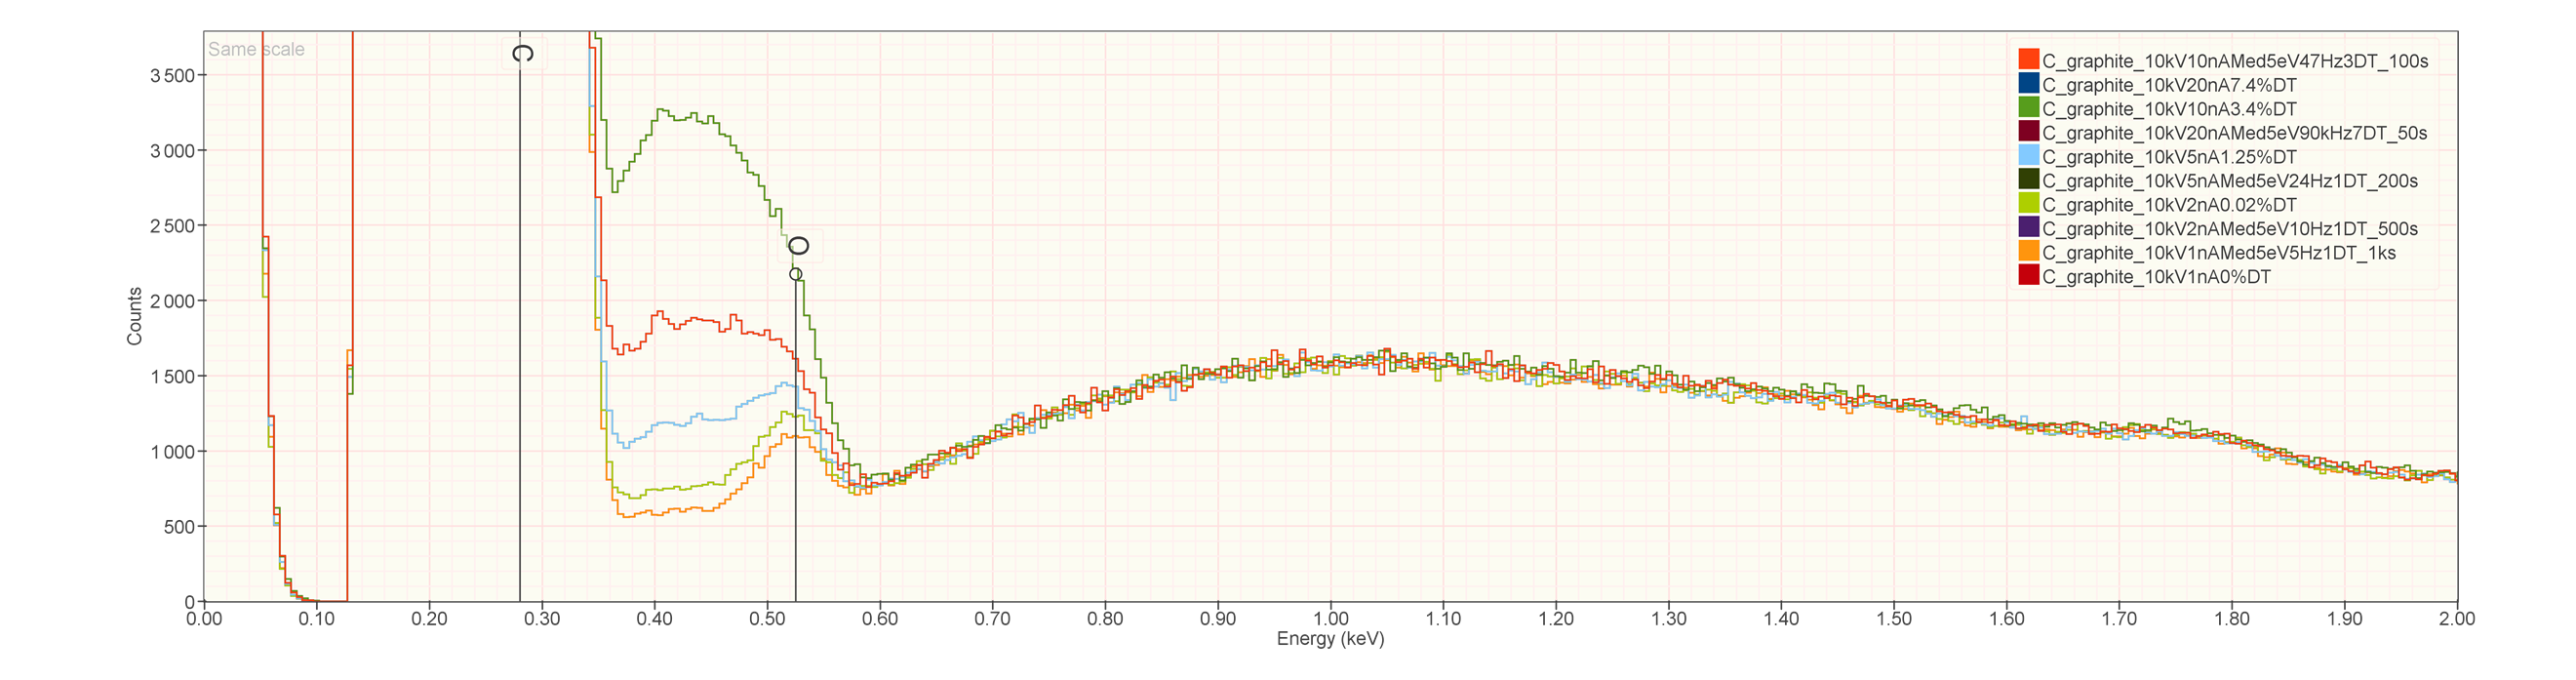
Figure 5: Data from Dale Newbury (2017-09-18).
Dale wrote:
Your deadtime series is the right thing to do in order to explore the O in C problem. Attached is a deadtime series (E0 = 10 keV) on high purity graphite from one of our instruments (with four Pulsetor SDDs). As you can see, as the deadtime decreases toward zero for the same dose, the pile-up continuum from C K plus bremsstrahlung located between C K and O K decreases and reveals what appears to be a very low level O K peak at the correct energy (0.523 keV). A pure C K pile-up peak would be expected to be located at 2 x 0.282 keV = 0.564 keV, so this does appear to be a legitimate O K peak. Since the oxides of C are both volatile gases (CO and CO2), I suspect this oxygen is present either as an embedded impurity or else as a surface deposit, as some sort of complex C-H-O species, perhaps a wax.
He made this comment on my Oxford data montage (I had told him about the inability to export pulse-processor corrected data)
Yes, their pile-up correction seems very nice, but I can’t understand either why they won’t give a user access to both the original spectrum and the corrected spectrum. After all, we paid for it! You would think they would want to show off their prowess at correction of this annoying problem of pile-up! I agree with your interpretation that a valid O K peak exists as you show after minimizing the throughput.